


LTV
LTV means lifetime value, also called customer lifetime value or CLV. It estimates the economic value a customer is expected to generate across the full relationship with a company.
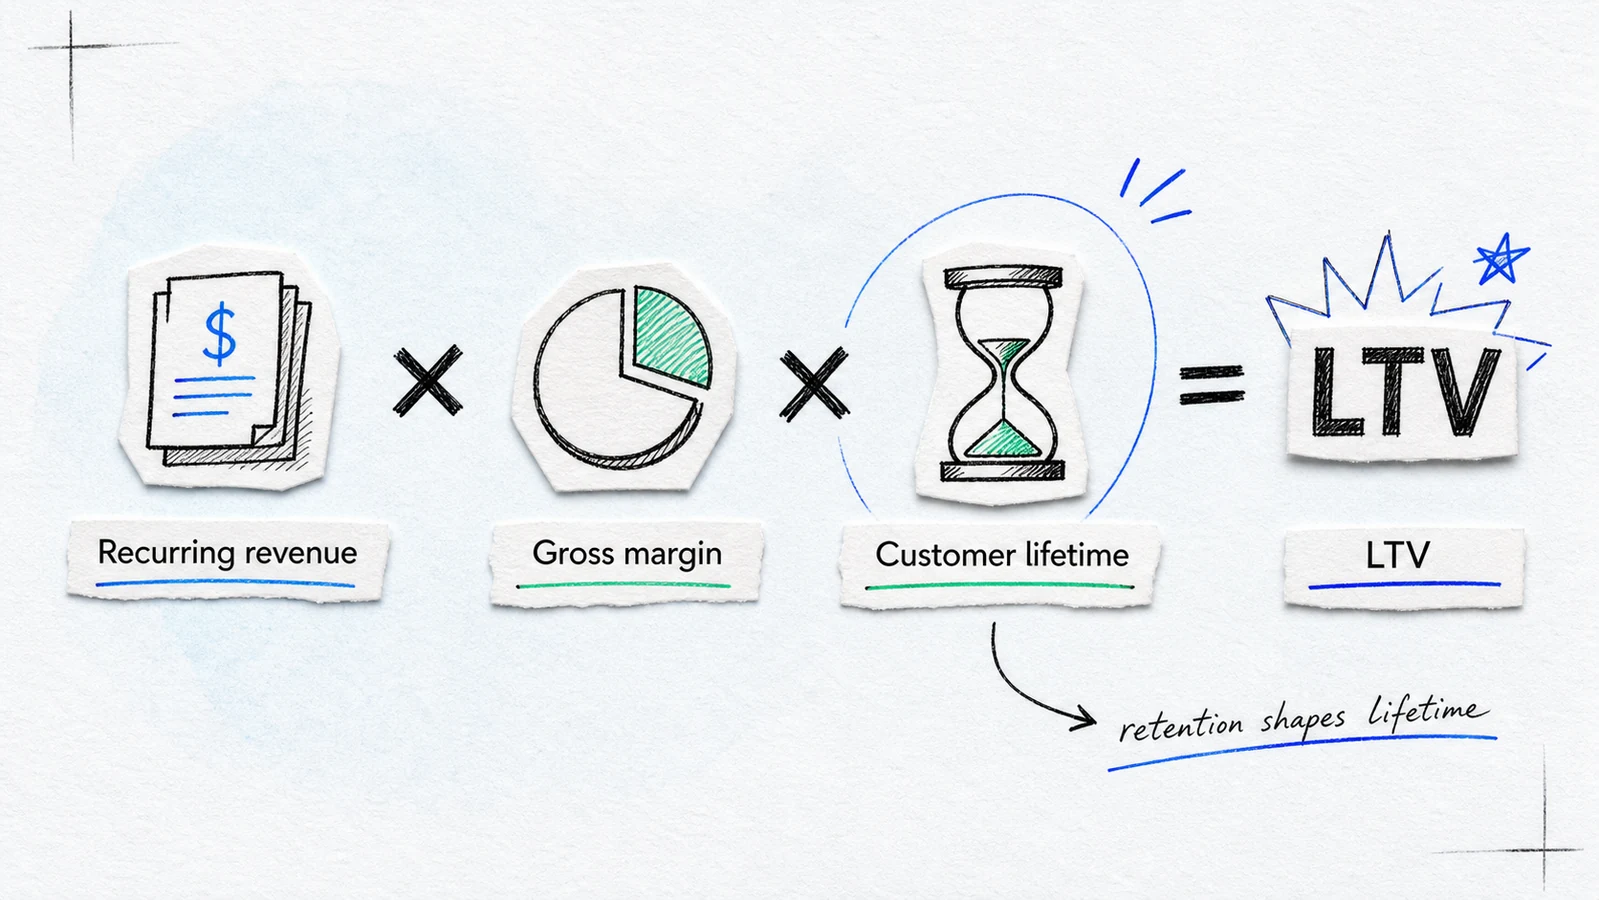
For SaaS, LTV is usually based on recurring revenue, gross margin, retention, and customer lifetime. A simplified formula is:
LTV = average recurring revenue per customer x gross margin x average customer lifetime
Some teams estimate lifetime from churn. The method should match the business model and use stable cohorts wherever possible.
Why it matters
LTV helps a company understand how much customer value exists beyond the first contract or month. That affects how much the business can afford to spend on CAC, onboarding, customer success, support, and expansion.
The metric also changes how a team reads growth. Two segments can have the same ACV but very different LTV if one retains longer, expands more, or requires less delivery cost.
For an early SaaS company, LTV should be treated as an estimate, not a fact. Short company history, small cohorts, changing pricing, and uneven churn can produce false precision.
How it works
First, define the unit: customer, account, user, or subscription.

Second, calculate recurring revenue for that unit over a consistent period.
Third, apply gross margin so the metric reflects value after direct delivery costs.
Fourth, estimate the customer lifetime using retention or churn behavior.
Fifth, separate segments when their economics differ. Enterprise and self-serve customers may have different acquisition, support, retention, and expansion patterns.
Expansion can be included when the data supports it. Some teams use historical cohort revenue instead of a formula because it captures contraction, expansion, and churn more directly.
Cohort views are especially useful when recent customers behave differently from older ones. A single blended average can easily hide improving onboarding, changing expansion, or worsening retention across customer segments.
That is why cohort history matters.
SaaS example
Suppose a customer pays $1,000 per month, the gross margin is 80%, and the expected relationship lasts 30 months. The simplified LTV is $24,000.
That estimate can change quickly if retention weakens. Increasing lifetime from 30 to 36 months creates more value without acquiring another customer. This is one reason product-led growth, onboarding, and customer success cannot be separated from acquisition economics.
RevOps should keep the source data, cohort definitions, and reporting logic consistent.
Common mistakes
The first mistake is using revenue instead of gross profit.
The second mistake is applying one average to customer groups with very different behavior.
The third mistake is using a short, volatile churn period to project several years.
The fourth mistake is assuming expansion will continue without evidence.
How we see it
LTV is most useful as a decision range. The goal is to understand which customers create durable value and which retention assumptions the GTM model depends on.