


CAC
CAC means customer acquisition cost. It measures how much a company spends to acquire a new customer during a defined period.
The basic formula is:
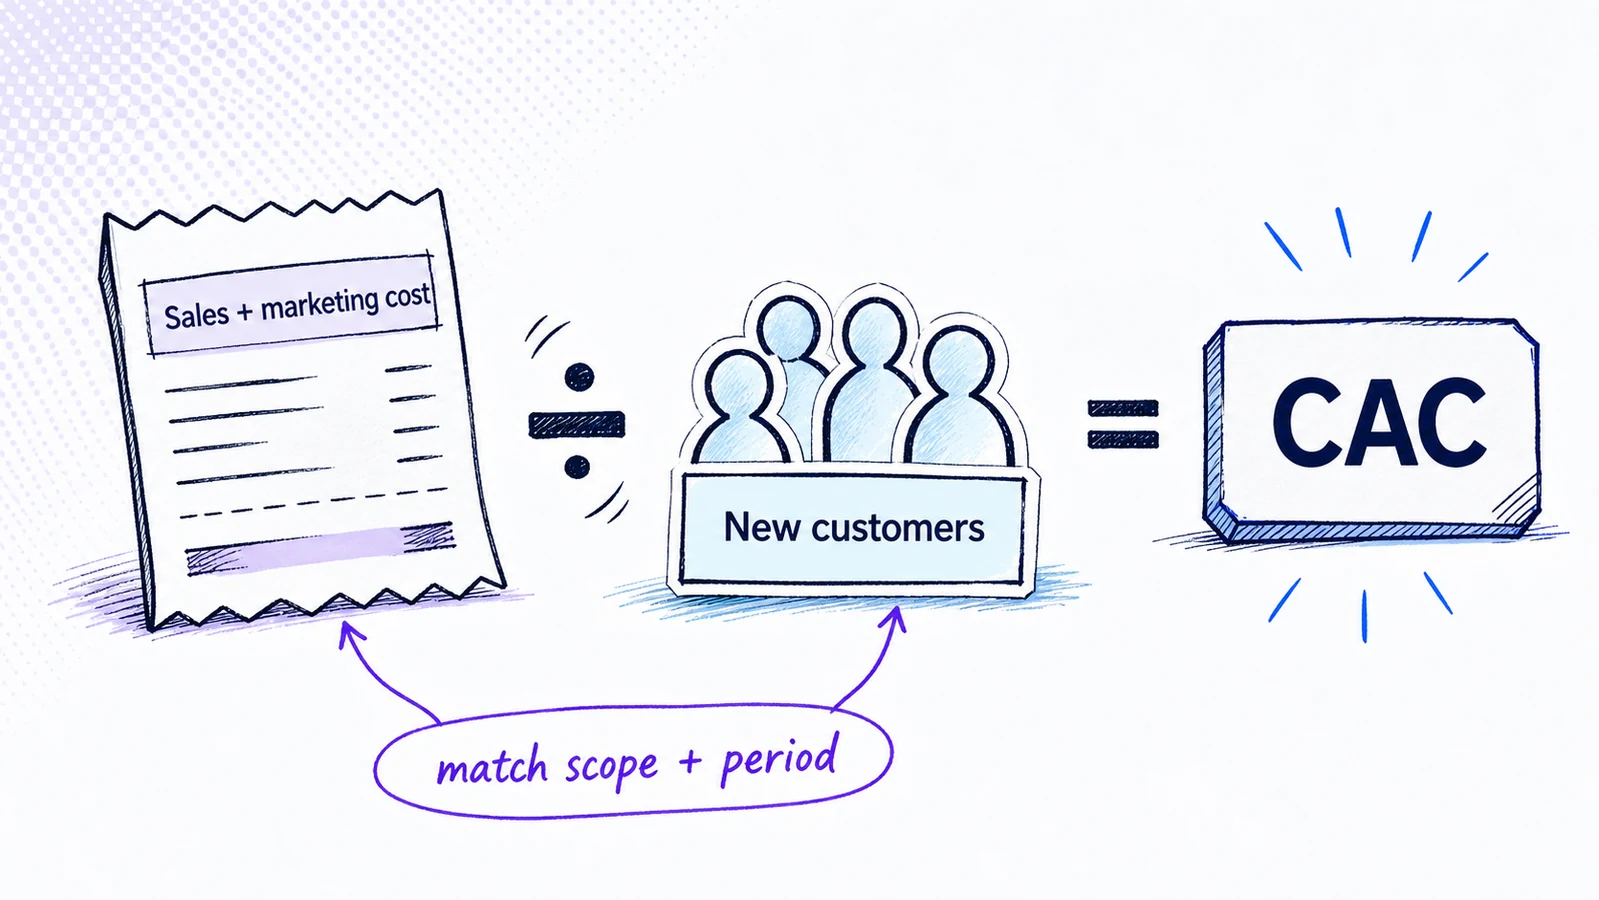
CAC = sales and marketing acquisition cost / new customers acquired
The exact calculation depends on scope. A company may calculate blended CAC across all channels, paid CAC for advertising, or segment-level CAC for a specific market. The numerator and denominator must cover the same period and customer group.
Why it matters
Revenue can grow while acquisition becomes less efficient. CAC helps a SaaS company see how much money it must spend before a new customer starts contributing value.

CAC is useful alongside LTV, gross margin, retention, and payback period. A high acquisition cost may be reasonable for a high-value, durable customer. A lower CAC can still be unhealthy if the customers churn quickly or require expensive support.
The metric also changes GTM decisions. A company may compare acquisition economics across content, partnerships, paid demand, sales-led motions, and product-led growth.
How it works
First, define which costs belong in the numerator. Depending on the purpose, this may include advertising, salaries, commissions, agencies, tools, events, content, and allocated overhead.
Second, count only new customers acquired within the same scope and period.
Third, choose the right view. Blended CAC shows the full motion. Channel CAC helps compare sources. Segment CAC shows whether one GTM motion is more expensive than another.
CAC often needs a lag adjustment. Sales and marketing spend this quarter may produce customers next quarter. Long sales cycles can make a simple monthly calculation misleading.
Teams should also separate acquisition work from retention and expansion work when the metric is used to compare new-customer efficiency. The accounting boundary and allocation method need to be documented clearly for every reporting period.
Documenting the scope makes channel and segment comparisons easier to audit.
SaaS example
Suppose a SaaS company spends $120,000 on sales and marketing acquisition work during a quarter and acquires 40 new customers within the matched cohort. Its CAC is $3,000.
That number needs context. If the average customer produces strong margin for several years, the economics may work. If most customers leave after six months, the same CAC may be unsustainable.
ACV and the sales funnel can explain why acquisition cost differs across segments and motions.
Common mistakes
The first mistake is excluding salaries or tools to make CAC look lower.
The second mistake is mixing leads, accounts, and customers in the denominator.
The third mistake is comparing channels that use different attribution windows.
The fourth mistake is reading CAC without retention, margin, and payback.
How we see it
CAC is not a score to minimize at any cost. It is a constraint that helps the company decide which customer, channel, and motion can support durable growth.