


How to build a customer health score: metrics, weights, and examples
To build a customer health score, choose a customer segment and a decision the score should support. Define the evidence that matters, normalize each input, assign provisional weights, and calculate a total. Then add missing-data rules, critical-risk exceptions, and an owner for the response. Test the model against later customer outcomes before calling it predictive.
A useful customer health score compresses evidence without hiding its limitations. The total should never be the only thing a customer success manager sees. Keep the component scores, evidence dates, coverage, and reason for the latest change beside it.
Define the decision and customer cohort
Start with a narrow question: which established customers need an adoption or renewal-risk review this week?
That decision is different from asking which new customers are ready to leave onboarding or which accounts could buy another product. Separate those models when the expected behavior differs materially.
A monthly finance-close product makes the distinction clear. During SaaS customer onboarding, the important milestones might be connecting the ledger and completing the first close. For an established customer, setup activity should contribute nothing. Repeated close completion, team participation, and evidence of the agreed outcome matter more.
Write down the model's unit, segment, lifecycle stage, and intended response. For example: account-level scoring for established midmarket customers using the monthly-close module. Exclude trial accounts and customers still implementing it.
Also choose an observation window appropriate to the product's natural cadence. A weekly absence means something different in a daily collaboration tool than in software used at month-end.
Select metrics that reflect customer value
Use a small number of distinct dimensions. Each should add information that the others cannot supply.
For the finance product, five useful candidates are:
- Outcome progress: whether the customer achieved the agreed close milestone.
- Meaningful adoption: how broadly the intended team completed the relevant process.
- Stakeholder coverage: whether an active sponsor and operational owner remain engaged.
- Support condition: whether unresolved issues prevent the customer from completing that process.
- Commercial readiness: whether renewal ownership, budget discussion, and procurement next steps are understood.
These are starting choices, not universal metrics. ChurnZero's health-score guidance supports combining behavioral and qualitative evidence and tailoring it to lifecycle context.
Avoid giving several highly correlated activity measures separate large weights. Logins, sessions, and page views may describe the same behavior three times. For product adoption, choose a meaningful completed action and a relevant denominator, such as the intended team, rather than every purchased seat by default.
Commercial context deserves its own inspection. ChurnZero's 2025 Customer Revenue Leadership Study reports NRR of 100% among respondents purchasing normally, versus 93% for those delaying major decisions by three to six months and 94% for delays of six months or more. The overall study had 793 voluntary respondents.
Those are associations across respondent groups. They do not prove that buying delays cause lower NRR, and they provide no formula for health-score weights. They do give you a reason to inspect purchasing conditions alongside usage.

Normalize inputs before assigning weights
Raw inputs have incompatible units. You cannot meaningfully add completed closes, stakeholder counts, and unresolved tickets.
Create a common component scale, such as 0 to 100, with a documented mapping for each input. Keep the original value available so the normalization can be challenged.
For an illustrative outcome component, 100 could mean the agreed milestone was achieved, 75 that it was partially achieved with a dated recovery plan, 25 that it was missed without a credible plan, and 0 that the customer confirmed the intended result was not attainable. Missing evidence is a separate state, not 0.
For adoption, define the action before selecting a threshold. Amplitude's retention documentation makes this measurement choice explicit: analysis depends on the starting event, returning event, and selected population. Returning to an application is not the same as renewing an account contract.
For every metric, record:
- Source system and account identifier.
- Raw event or observation and denominator.
- Observation period and last successful refresh.
- Mapping from raw evidence to the component score.
- Missing or stale status and the person responsible for resolving it.
Qualitative inputs need equally explicit anchors. "Sponsor confirmed the next review and named an owner" is more reproducible than "relationship feels good."
Calculate a transparent weighted score
The basic formula is:
Health score = sum of each component score multiplied by its weight.
Weights should sum to 100%. They express the relative influence you intend each dimension to have, not the confidence of the underlying evidence.
Here is a fictional starting model for an established finance-close account. The weights and scores are teaching examples, not observed benchmarks.
| Component | Weight | Example score | Weighted contribution |
|---|---|---|---|
| Outcome progress | 35% | 75 | 26.25 |
| Meaningful adoption | 25% | 50 | 12.50 |
| Stakeholder coverage | 15% | 50 | 7.50 |
| Support condition | 15% | 100 | 15.00 |
| Commercial readiness | 10% | 75 | 7.50 |
| Total | 100% | 68.75 |
The account scores 68.75 out of 100. That is not a 68.75% probability of renewal.
This model places the greatest influence on customer outcomes and adoption because those are the dimensions the example team intends to investigate first. Another product may require a different allocation.
Before accepting a weight, change that component from healthy to weak while holding everything else constant. Does the total move enough to prompt a sensible response? Then test whether several minor positives can conceal one serious problem.
Document the rationale and version the model. Unrecorded weight changes make historical comparisons difficult to interpret.
Make missing data and hard risks visible
Suppose the stakeholder component disappears because the CRM integration fails. Its 7.50 contribution drops out, leaving 61.25 points across 85% of the intended weight.
Renormalizing only the available dimensions gives 61.25 / 0.85, or 72.06. The displayed total rises from 68.75 even though nothing improved for the customer.
This is a real configuration concern. Gainsight documents different redistribution behavior for its older and newer group-weighting systems. Inspect the rules your actual implementation applies.
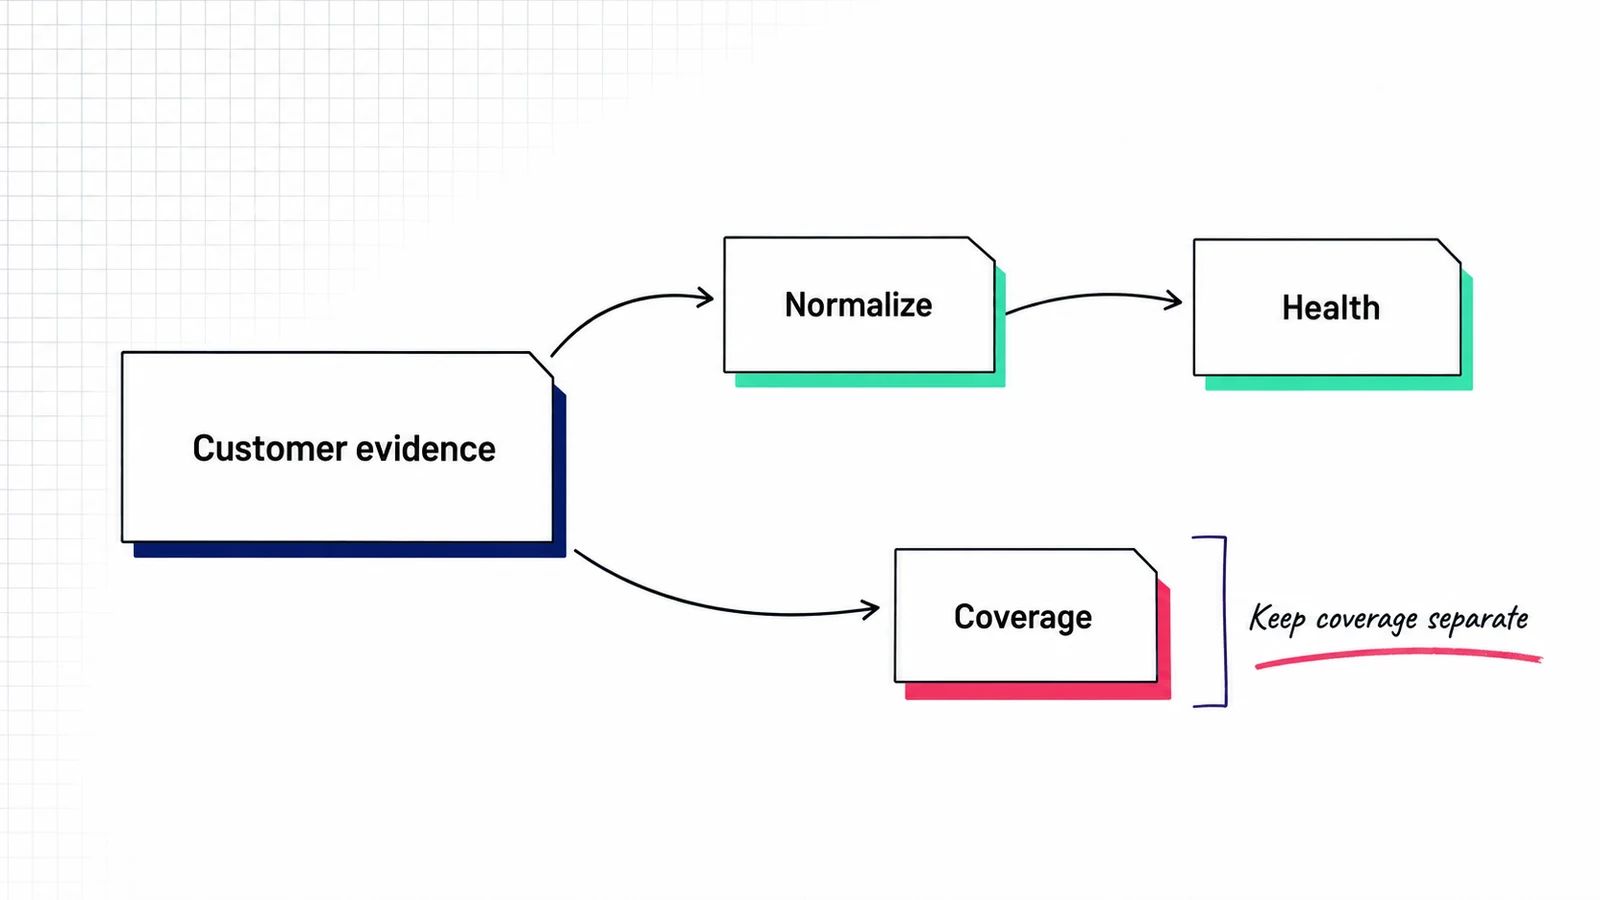
Keep evidence coverage separate:
Evidence coverage = total configured weight of the valid, current inputs.
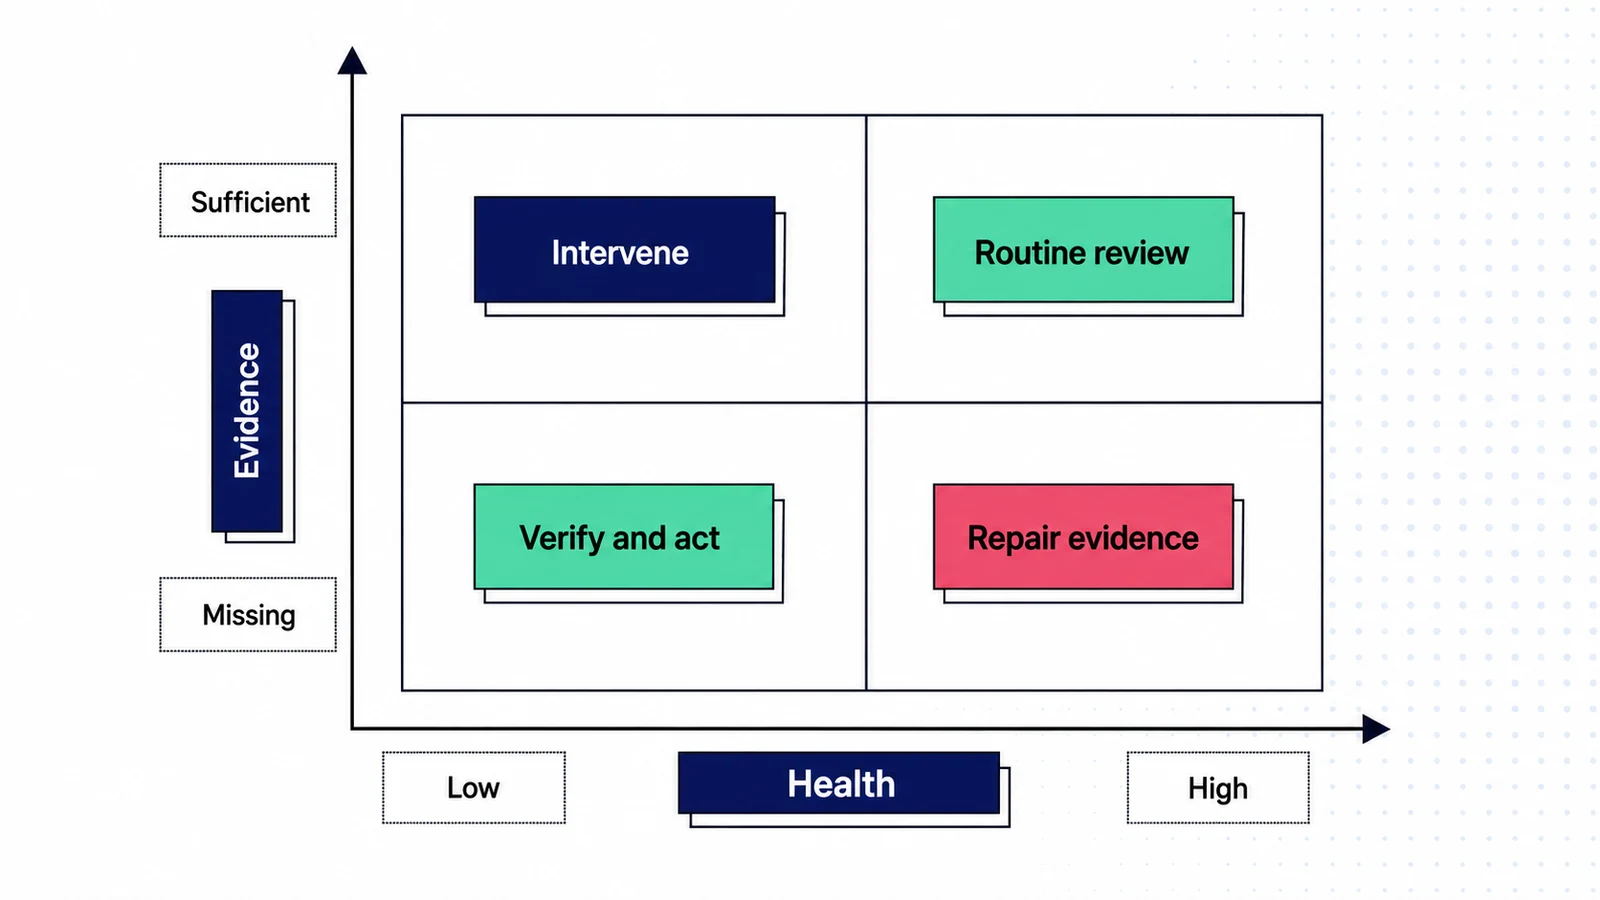
For this example, coverage is 85%. You may display a provisional total, but it should not silently become an ordinary healthy state. A missing critical input can block that state even when overall coverage looks adequate.
A practical starting policy is to flag coverage below 80% as insufficient and require all designated critical inputs. That floor is another hypothesis to test, not an industry standard.
Treat confirmed serious risks separately too. A written cancellation notice, a lost sponsor without replacement, or a blocker that prevents the core process may require immediate review regardless of the average. Gainsight's exception documentation confirms that exceptions can supersede ordinary weighted calculations.
Preserve the source components and record the exception reason. Do not let a manual override erase the evidence trail.
Route changes to a named response
Define the response before activating alerts. A possible starting policy for the fictional model is:
| State | Example rule | Response |
|---|---|---|
| Routine | Score at least 80, sufficient evidence, no exception | Normal account review |
| Diagnose | Score 60 to below 80 | CSM reviews the weakest relevant dimension |
| Recovery | Score below 60 | Named owner agrees a recovery plan |
| Insufficient evidence | Coverage below 80% or missing critical input | Repair evidence; retain independently verified risk response |
| Critical exception | Confirmed serious risk | Escalate to the responsible owner |
These are action bands, not forecasts. The customer success strategy should define ownership and capacity to respond.
If the sponsor leaves, verify the change, identify replacement coverage, and agree the next customer conversation. Log whether the alert was accurate, who accepted it, and when the account will be reviewed again.
Keep expansion readiness separate. A healthy account without an additional need is not automatically a candidate for an expansion revenue strategy.

Test the model before scaling it
Begin with account review, then move to historical testing.
Ask customer-facing owners to inspect examples across every band. Look for healthy accounts classified as weak, serious risks hidden in green, and records whose classification depends on unreliable evidence.
Next, create a snapshot before each historical renewal decision. Use only information that was available at that snapshot date. Including a cancellation note entered after the outcome would make the model appear more informative than it was.
Use cohort analysis to compare like accounts: lifecycle stage, product, contract type, and customer segment. Choose the outcome explicitly. Logo renewal, contraction, and revenue churn are not interchangeable.
For each band, count accounts, later outcomes, missing inputs, and alerts. Inspect both errors: risks the model missed and alerts that consumed attention without revealing a relevant issue. Keep account-level and revenue-weighted results separate so one large contract cannot hide poor account classification.
Separate model development from evaluation. Choose rules on an earlier cohort, then inspect a later cohort without changing the rules to fit it. Small samples may justify qualitative review but not precise performance claims.
Finally, preserve interventions. An at-risk account that renews after a successful recovery plan is not necessarily a false alarm. Conversely, a friendly survey response followed by churn is evidence to investigate, not proof that sentiment never matters.
The operating test is straightforward: can the owner explain the change, trust the evidence, and select a proportionate next action?
Frequently asked questions
Which metrics should a customer health score include?
Start with outcome progress, meaningful adoption, stakeholder coverage, support condition, and commercial context. Select only dimensions relevant to the segment and decision. Define each input's source, denominator, time window, and missing-data rule before adding it to the total.
How do you choose customer health score weights?
Begin with explicit hypotheses about relative importance. Test how each weight affects account classification, then compare pre-outcome snapshots with later results. Avoid importing another company's percentages. Keep model versions so revised weights do not silently rewrite the meaning of historical scores.
What is a good customer health score?
A good numerical result is specific to the model. An 80 in one system may mean something different elsewhere. Evaluate the documented action band, current evidence, and critical exceptions. A high total with missing stakeholder evidence may still require review.
How should missing inputs be handled?
Separate missing evidence from an observed low value. Record coverage and freshness, state any redistribution rule, and prevent critical missing inputs from producing an automatic healthy classification. Assign evidence repair to an owner without delaying action on independently verified customer risk.
Is a health score a renewal probability?
Usually it is an operational index. A weighted total does not become a probability because it uses a 100-point scale. Probability claims need outcome-based modeling and calibration on suitable evaluation data. Until then, describe the score as a prioritization aid.
Build the first model you can explain
Choose one segment and document its five most useful evidence dimensions. Calculate a few accounts manually, including one with missing data and one with a serious exception. Automate only after the customer-facing owner can explain every result and name the next response.
For more practical customer health scoring guidance, join the newsletter below.